生物信息分析
题目
你有一组转录组数据,希望对其进行详细的数据处理和数据展示,以探索基因表达的模式。给定数据集包括基因的表达量、样本信息以及可能的影响因素。请编写代码,实现以下任务:
- 数据清洗:去除异常值、处理缺失值,并根据实验设计进行适当的数据标准化。
- 数据探索分析:使用统计方法或可视化工具,分析不同样本类型之间基因表达的差异,并提供关键的统计摘要信息(如平均表达量、差异基因数等)。
- 基因关联网络构建:根据基因表达数据,构建基因关联网络,展示基因之间的相关性并识别可能的功能模块。
解答
安装并加载必要的库
# Load the required libraries
import pandas as pd
import numpy as np
import seaborn as sns
import matplotlib.pyplot as plt
import networkx as nx
from sklearn.preprocessing import MinMaxScaler
读入数据
# Read data
transcriptome_data = pd.read_csv('./data/GSE238099.csv')
进行预处理
此步骤包含若干分步骤:
- 对数据进行缩放
- 计算
fold change以及p-value - 设置自由度及阈值
transcriptome_data = transcriptome_data.replace(0, np.nan)
transcriptome_data.dropna(thresh=6, inplace=True)  # Drop genes with less than 6 samples
transcriptome_data[['t-Cont1', 't-Cont2', 't-Cont3', 't-Cont4', 't-Cont5', 't-Cont6', 't-KD1', 't-KD2', 't-KD3', 't-KD4', 't-KD5', 't-KD6']] = transcriptome_data[['t-Cont1', 't-Cont2', 't-Cont3', 't-Cont4', 't-Cont5', 't-Cont6','t-KD1', 't-KD2', 't-KD3', 't-KD4', 't-KD5', 't-KD6']].fillna(transcriptome_data[['t-Cont1', 't-Cont2', 't-Cont3', 't-Cont4', 't-Cont5', 't-Cont6', 't-KD1', 't-KD2', 't-KD3', 't-KD4', 't-KD5', 't-KD6']].mean())

# Scale the data
scaler = MinMaxScaler()

# min-max data scaling
transcriptome_data[['t-Cont1', 't-Cont2', 't-Cont3', 't-Cont4', 't-Cont5', 't-Cont6', 't-KD1', 't-KD2', 't-KD3', 't-KD4', 't-KD5', 't-KD6']] = scaler.fit_transform(transcriptome_data[['t-Cont1', 't-Cont2', 't-Cont3', 't-Cont4', 't-Cont5', 't-Cont6', 't-KD1', 't-KD2', 't-KD3', 't-KD4', 't-KD5', 't-KD6']])

# Calculate mean expression values
transcriptome_data['Ctrl_mean'] = transcriptome_data[['t-Cont1', 't-Cont2', 't-Cont3', 't-Cont4', 't-Cont5', 't-Cont6']].mean(axis=1)
transcriptome_data['KD_mean'] = transcriptome_data[['t-KD1', 't-KD2', 't-KD3', 't-KD4', 't-KD5', 't-KD6']].mean(axis=1)

# Calculate fold change and p-values
transcriptome_data['fold_change'] = transcriptome_data['KD_mean'] / transcriptome_data['Ctrl_mean']
p_values = []
transcriptome_data[['t-Cont1', 't-Cont2', 't-Cont3', 't-Cont4', 't-Cont5', 't-Cont6', 't-KD1', 't-KD2', 't-KD3', 't-KD4', 't-KD5', 't-KD6']] = transcriptome_data[['t-Cont1', 't-Cont2', 't-Cont3', 't-Cont4', 't-Cont5', 't-Cont6',  't-KD1', 't-KD2', 't-KD3', 't-KD4', 't-KD5', 't-KD6']].astype(float)

# Define the degrees of freedom
df = 6  # 6 samples in each group
from scipy.stats import t
def calculate_p_value(row):
    ctrl_expr = row[['t-Cont1', 't-Cont2', 't-Cont3', 't-Cont4', 't-Cont5', 't-Cont6']]
    kd_expr = row[['t-KD1', 't-KD2', 't-KD3', 't-KD4', 't-KD5', 't-KD6']]

    # Calculate the mean and standard deviation
    ctrl_mean = ctrl_expr.mean()
    kd_mean = kd_expr.mean()
    ctrl_std = ctrl_expr.std(ddof=1)
    kd_std = kd_expr.std(ddof=1)

    # Calculate the standard error
    stderr = np.sqrt(ctrl_std ** 2 / len(ctrl_expr) + kd_std ** 2 / len(kd_expr))

    # Calculate the t-value
    t_value = (kd_mean - ctrl_mean) / stderr

    # Calculate the p-value
    p_value = 2 * t.cdf(-np.abs(t_value), df)

    return p_value


# Use the function to calculate p-values
transcriptome_data['p_value'] = transcriptome_data.apply(calculate_p_value, axis=1)
transcriptome_data = transcriptome_data[~transcriptome_data['p_value'].isna()]
# Define the fold change threshold
fold_change_threshold = 2
设置差异基因组考察指标
# Select differentially expressed genes
differentially_expressed_genes = transcriptome_data[(transcriptome_data['fold_change'] >= fold_change_threshold) | (transcriptome_data['fold_change'] <= 0.5)]

# Output summary statistics
control_mean = transcriptome_data['Ctrl_mean'].mean()
kd_mean = transcriptome_data['KD_mean'].mean()
differential_genes_count = len(differentially_expressed_genes)
输出
The average expression in the control group: 0.0007321542838764879
The average expression in the knockdown group: 0.0008819992720793574
The number of differentially expressed genes: 3481
画出火山图
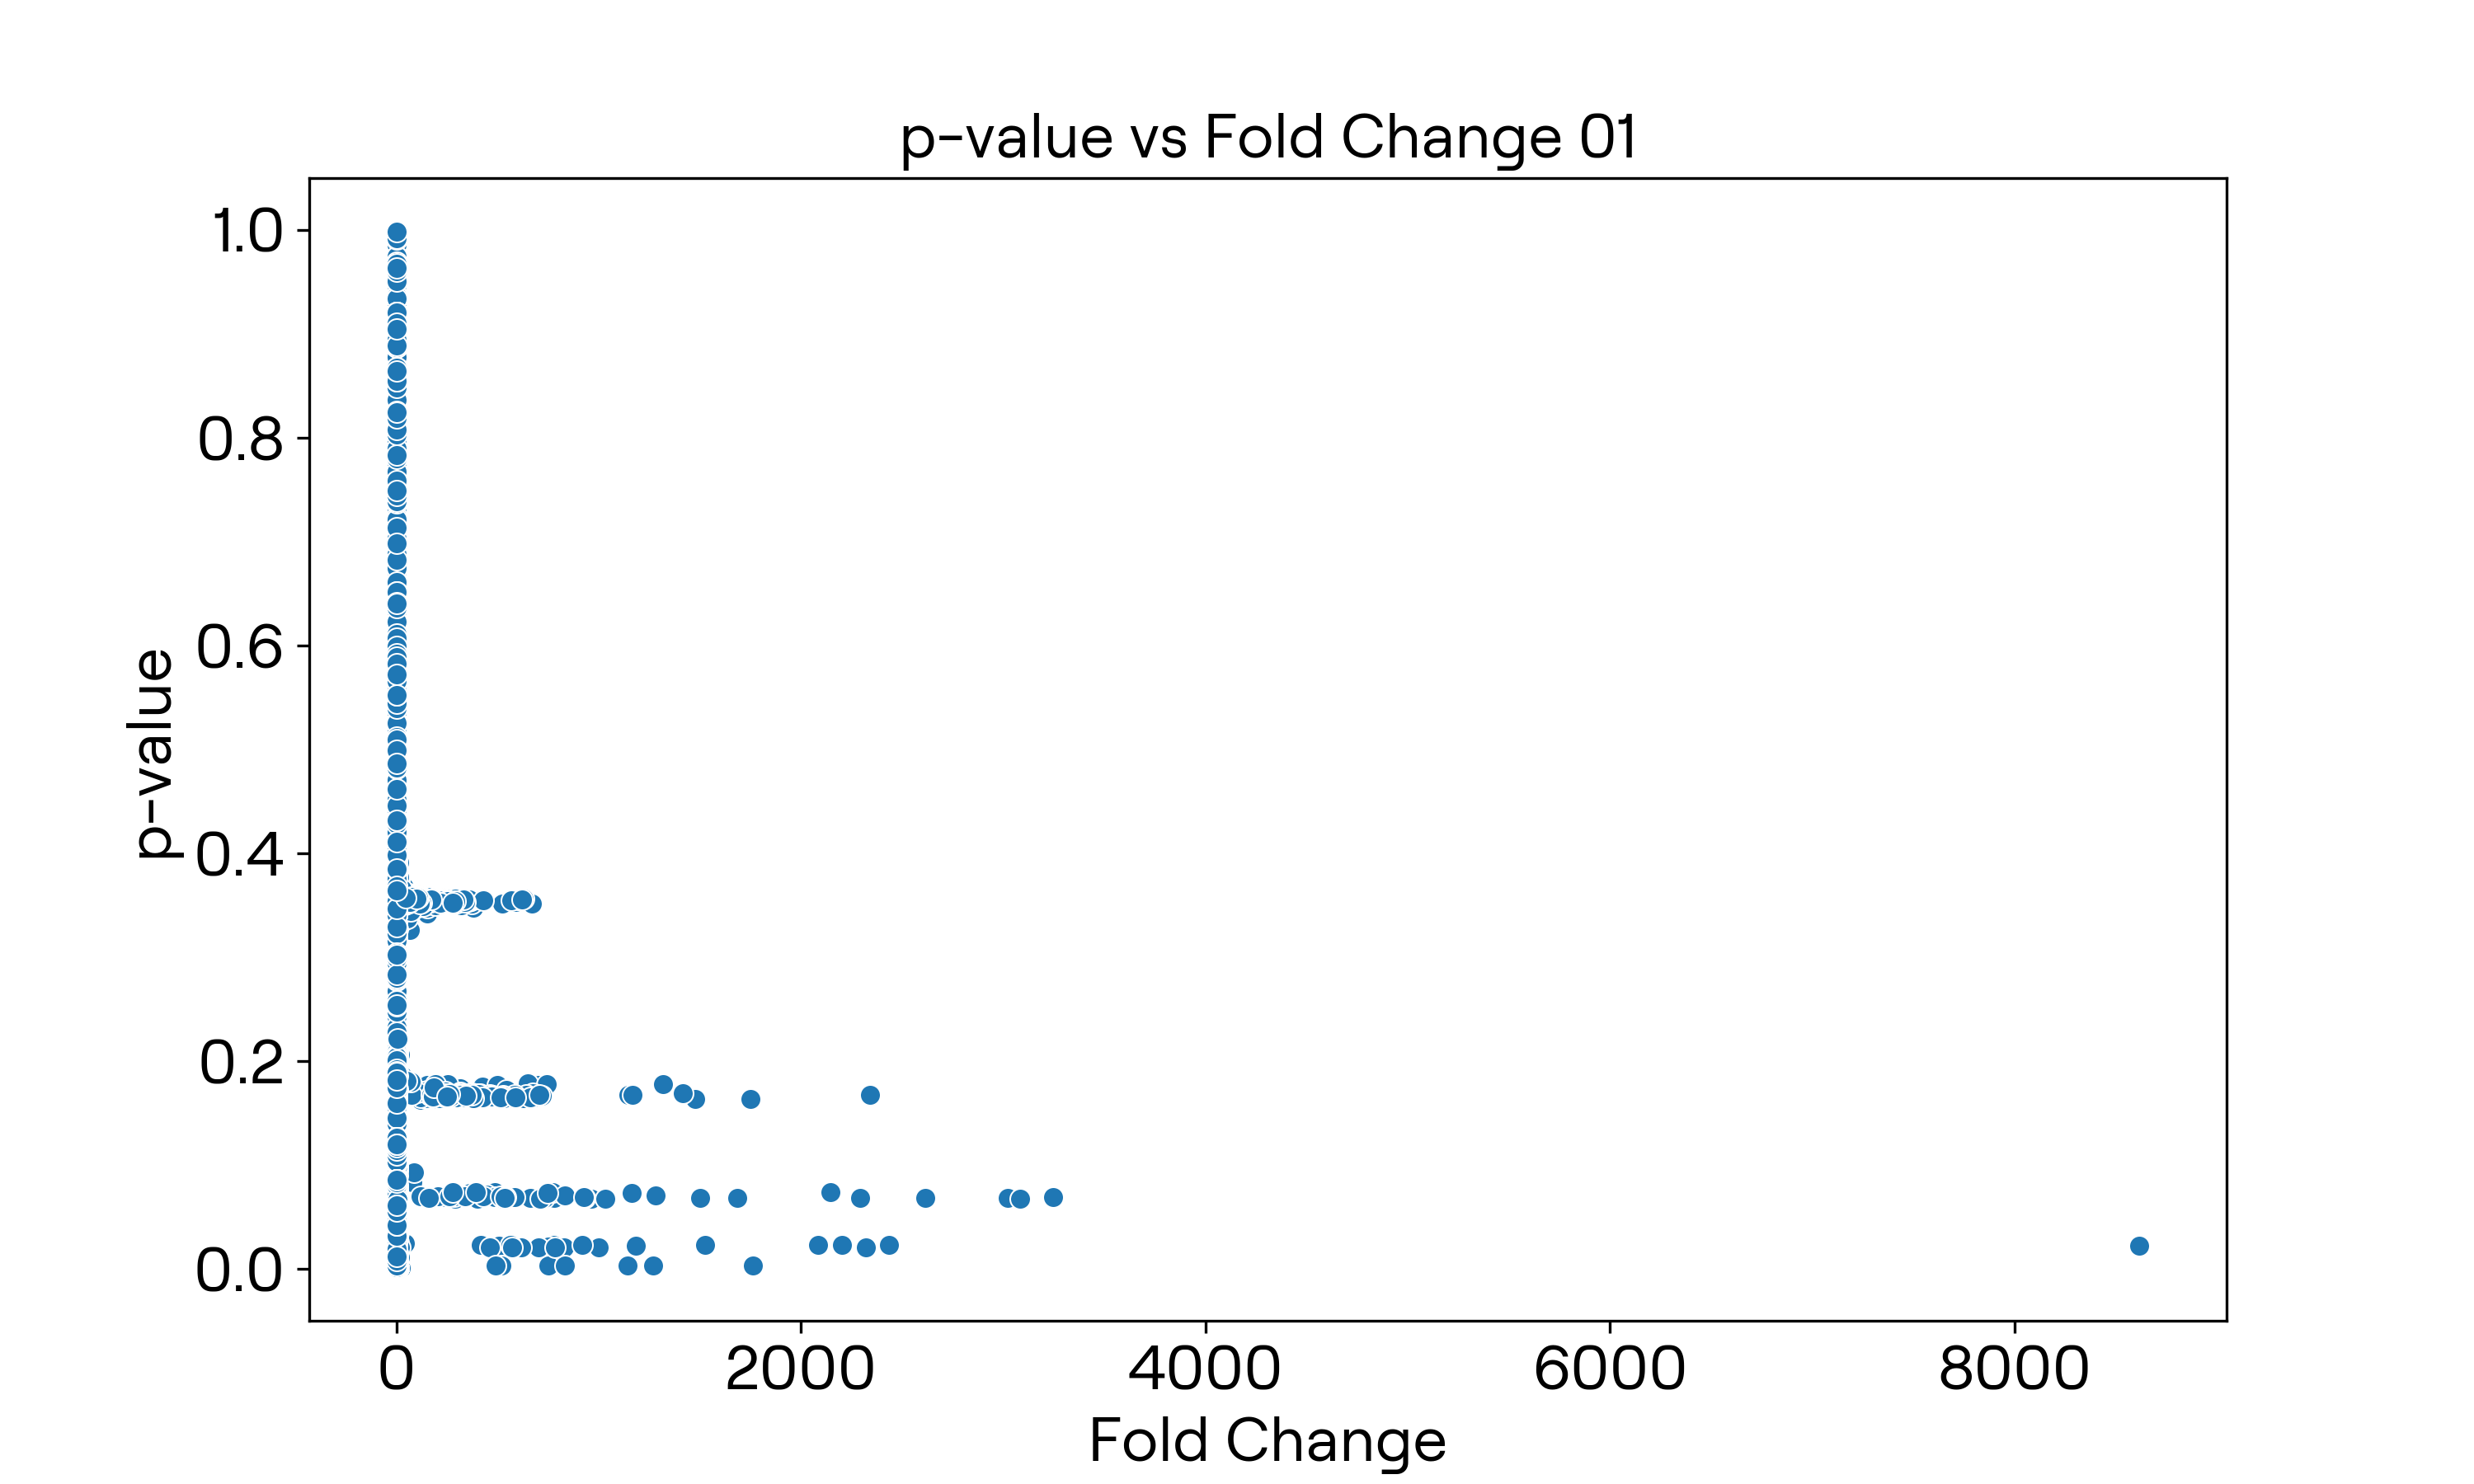
原始数据


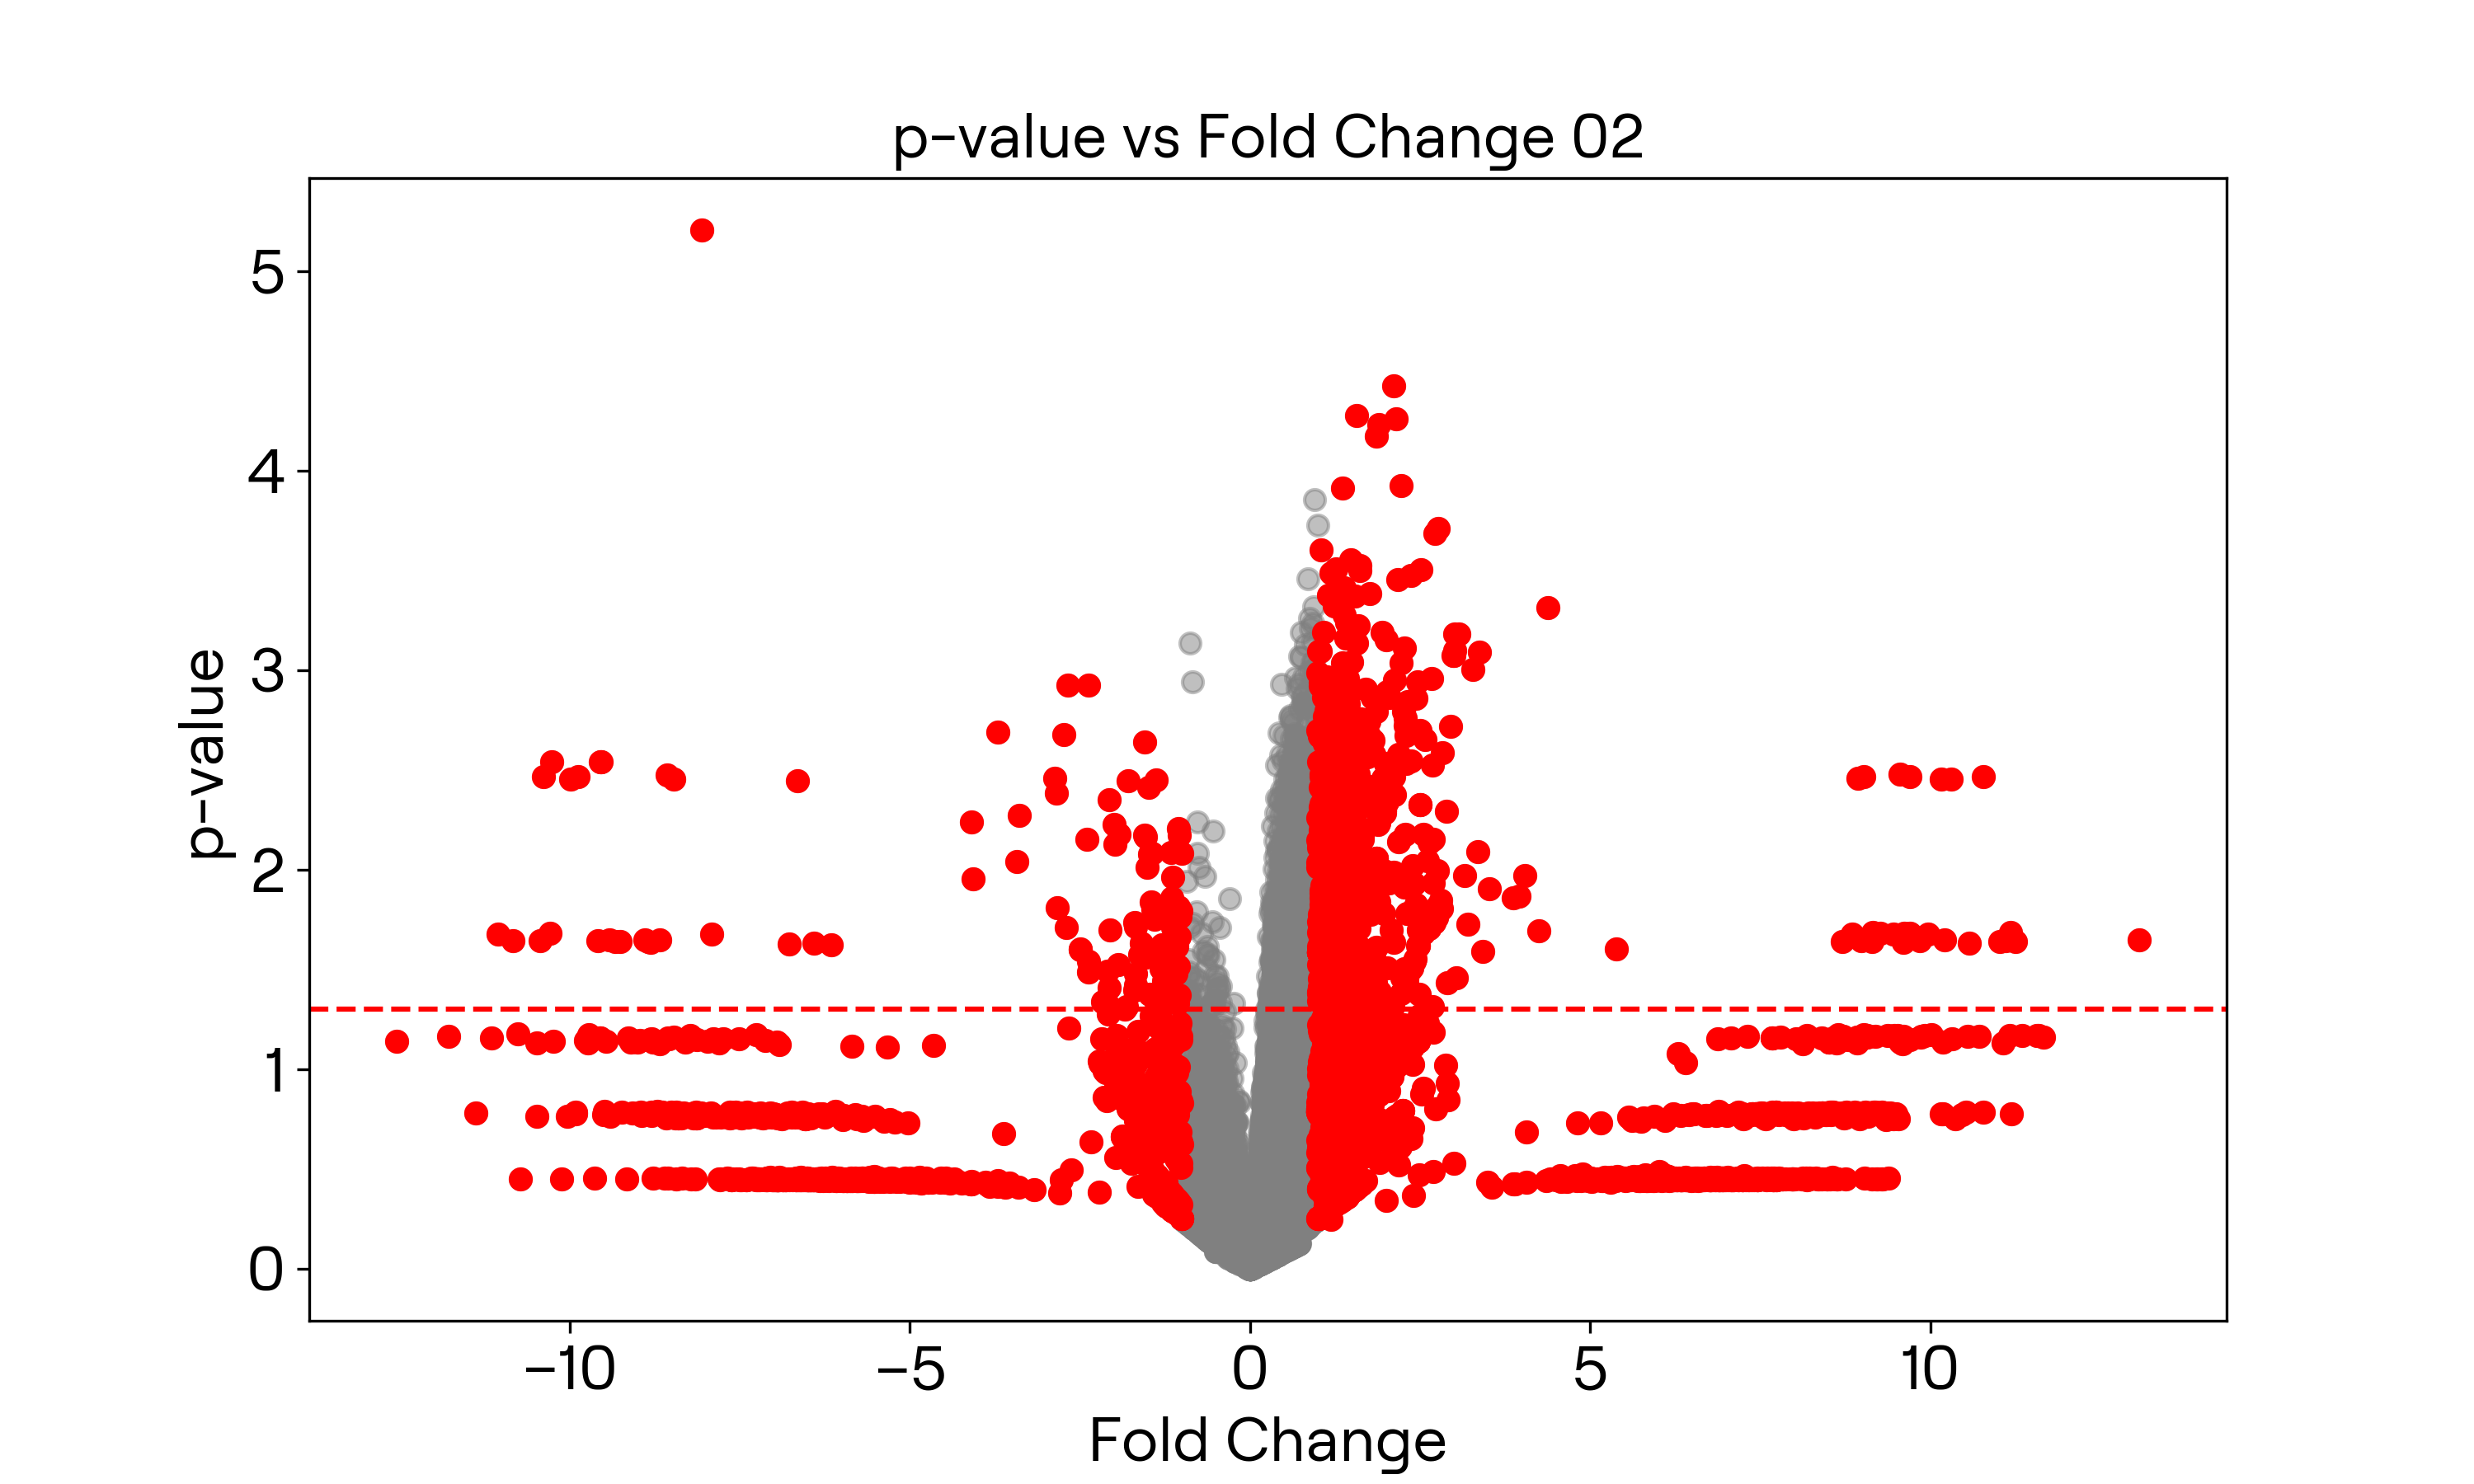
经过取对数之后的数据
横轴取$\log_2x$,纵轴取$-\log_{10}x$。


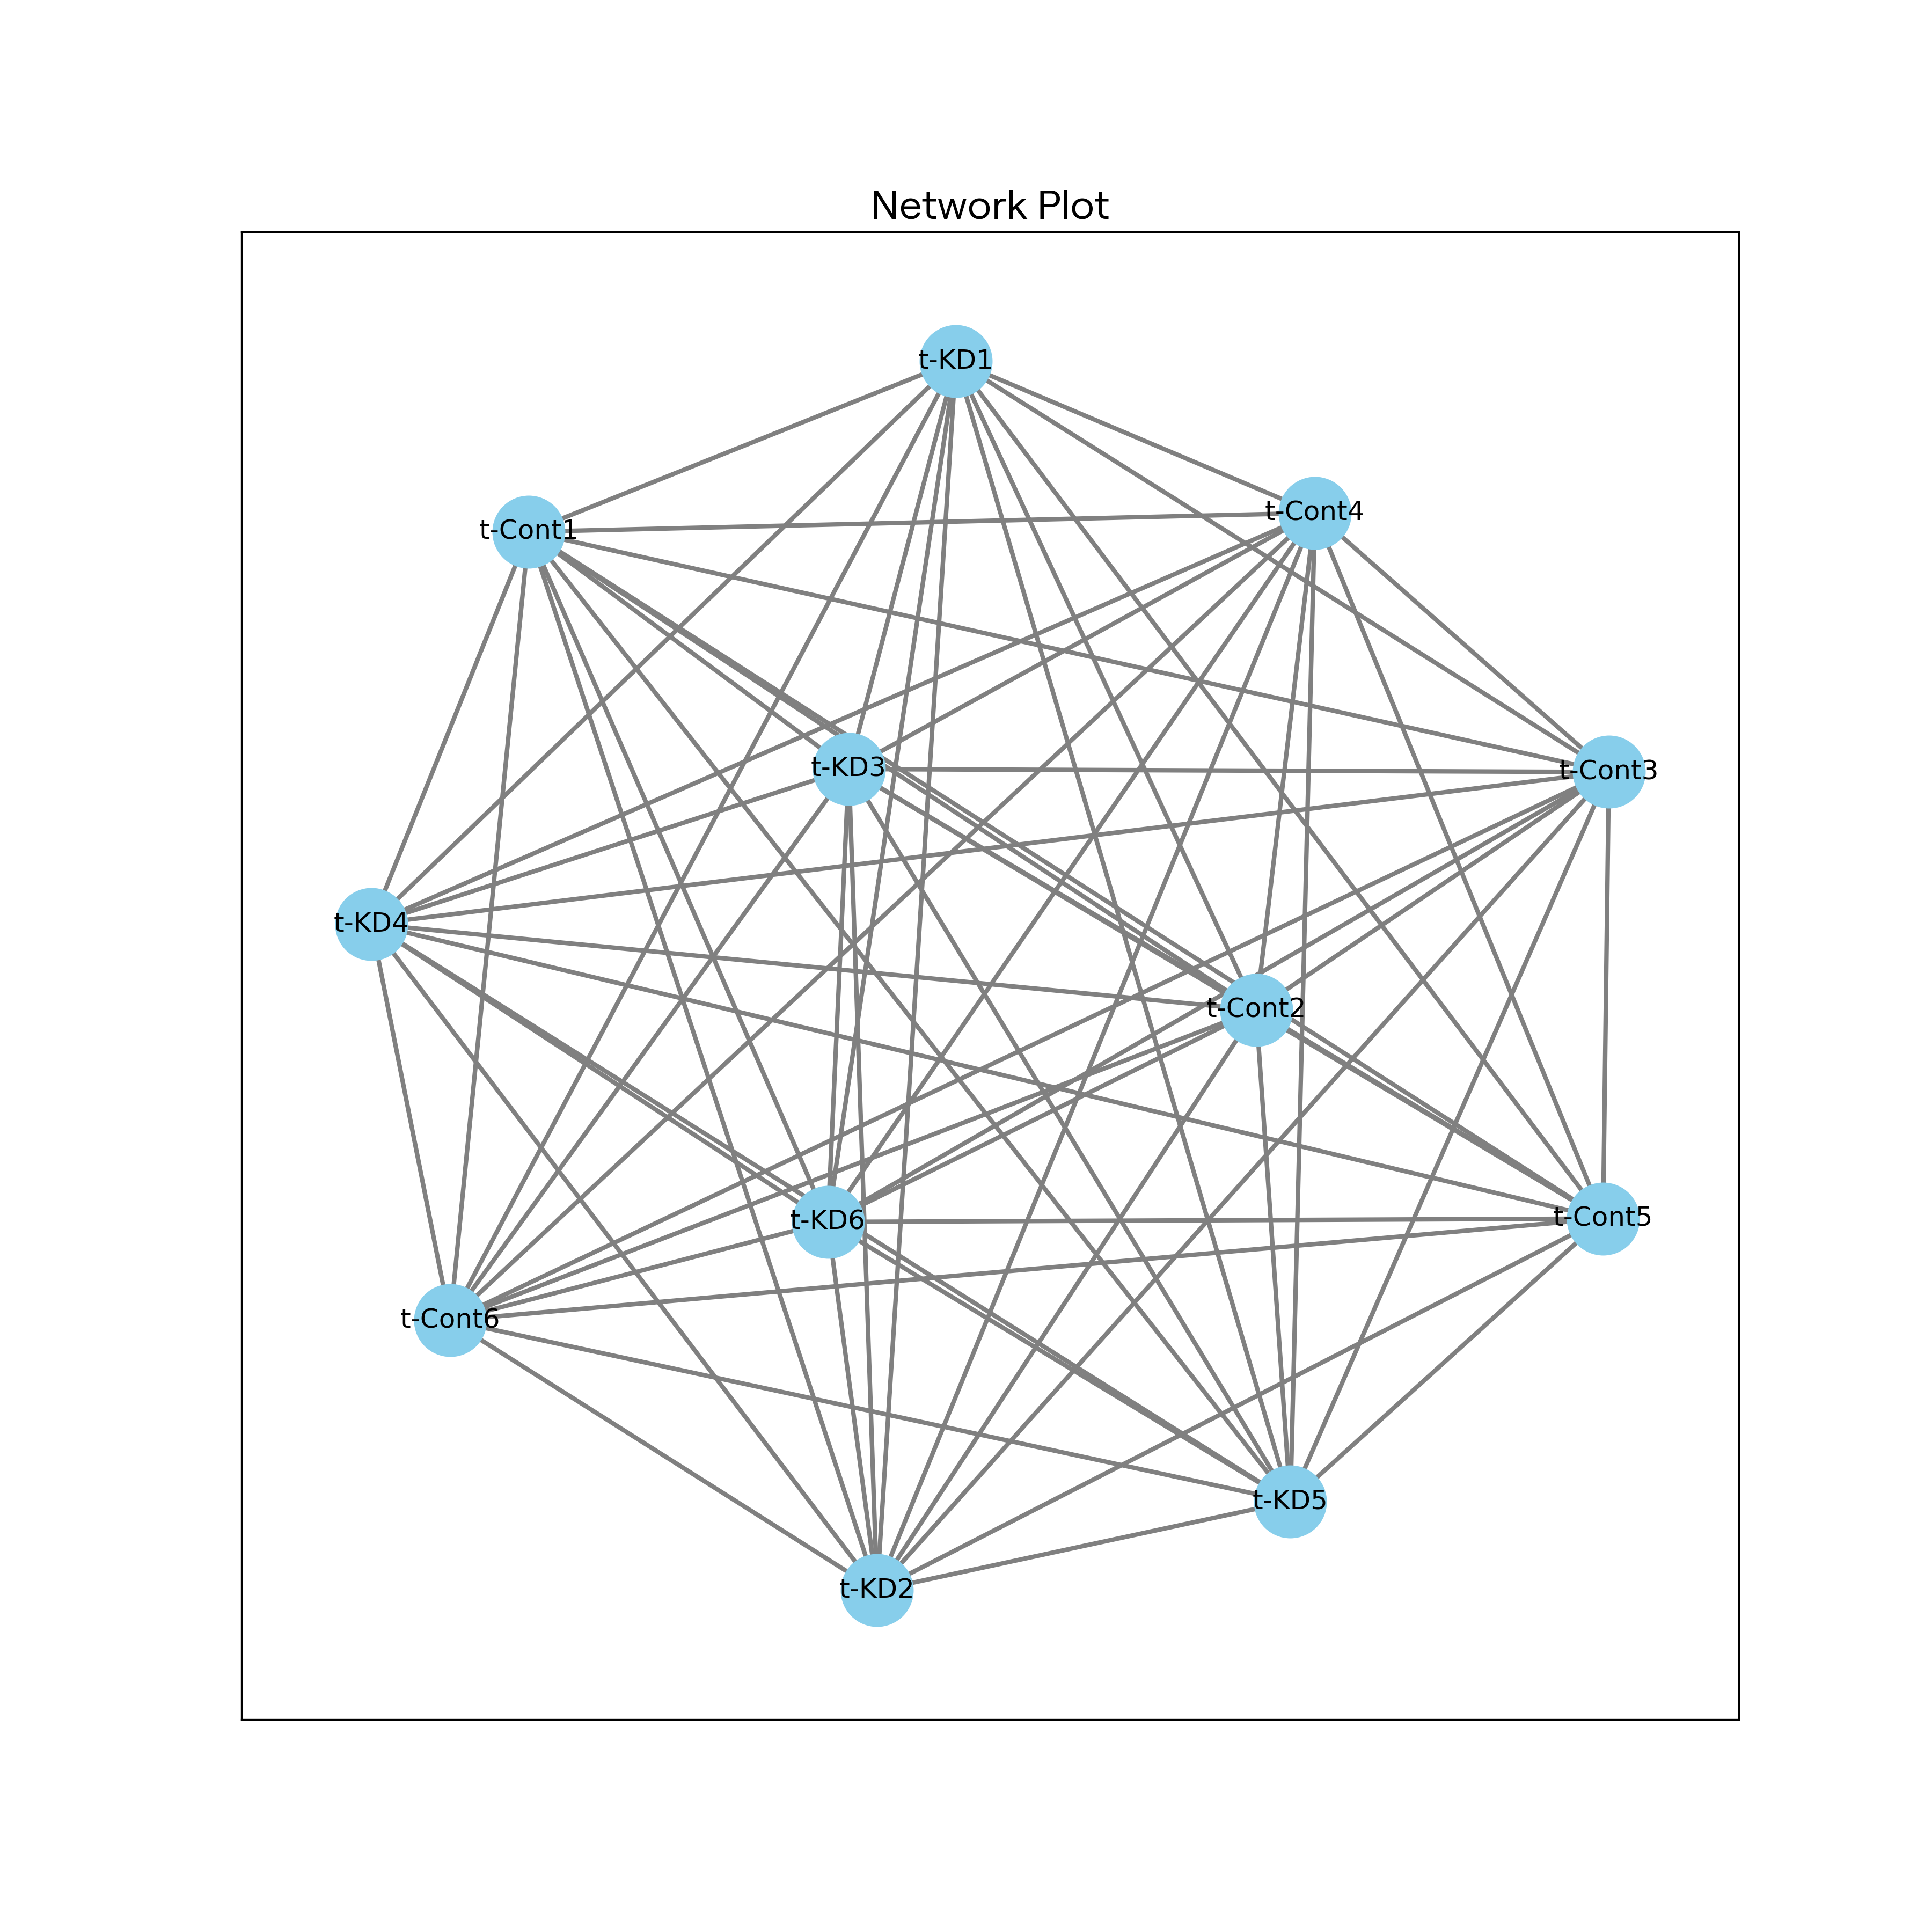
网络图


机器学习
题目
你希望使用一个简单的机器学习算法对给定的数据集进行分类。请使用简单的机器学习算法,对Titanic乘客的生存情况进行预测。
解答
安装并加载必要的库
# Importing the libraries
import pandas as pd
from sklearn.model_selection import train_test_split
from sklearn.linear_model import LogisticRegression
from sklearn.metrics import accuracy_score, confusion_matrix
import seaborn as sns
from matplotlib.font_manager import FontProperties
import matplotlib.pyplot as plt
读取数据集并预处理数据
# Load the titanic_data
titanic_data = pd.read_csv('./data/titanic.csv')
print(titanic_data.head())

# Pre-process the titanic_data

# Drop the columns that are not useful
x = titanic_data.drop(['Survived', 'Name', 'Sex'], axis=1)
y = titanic_data['Survived']

# Split the titanic_data into training and testing sets
x_train, x_test, y_train, y_test = train_test_split(x, y, test_size=0.2, random_state=42)
输出
   Survived  Pclass  ... Parents/Children Aboard     Fare
0         0       3  ...                       0   7.2500
1         1       1  ...                       0  71.2833
2         1       3  ...                       0   7.9250
3         1       1  ...                       0  53.1000
4         0       3  ...                       0   8.0500
训练数据,做出预测
# Train the model
model = LogisticRegression()
model.fit(x_train, y_train)

# Make predictions
y_pred = model.predict(x_test)
验证模型有效性
# Evaluate the model
accuracy = accuracy_score(y_test, y_pred)
print(f'Accuracy: {accuracy}')
输出
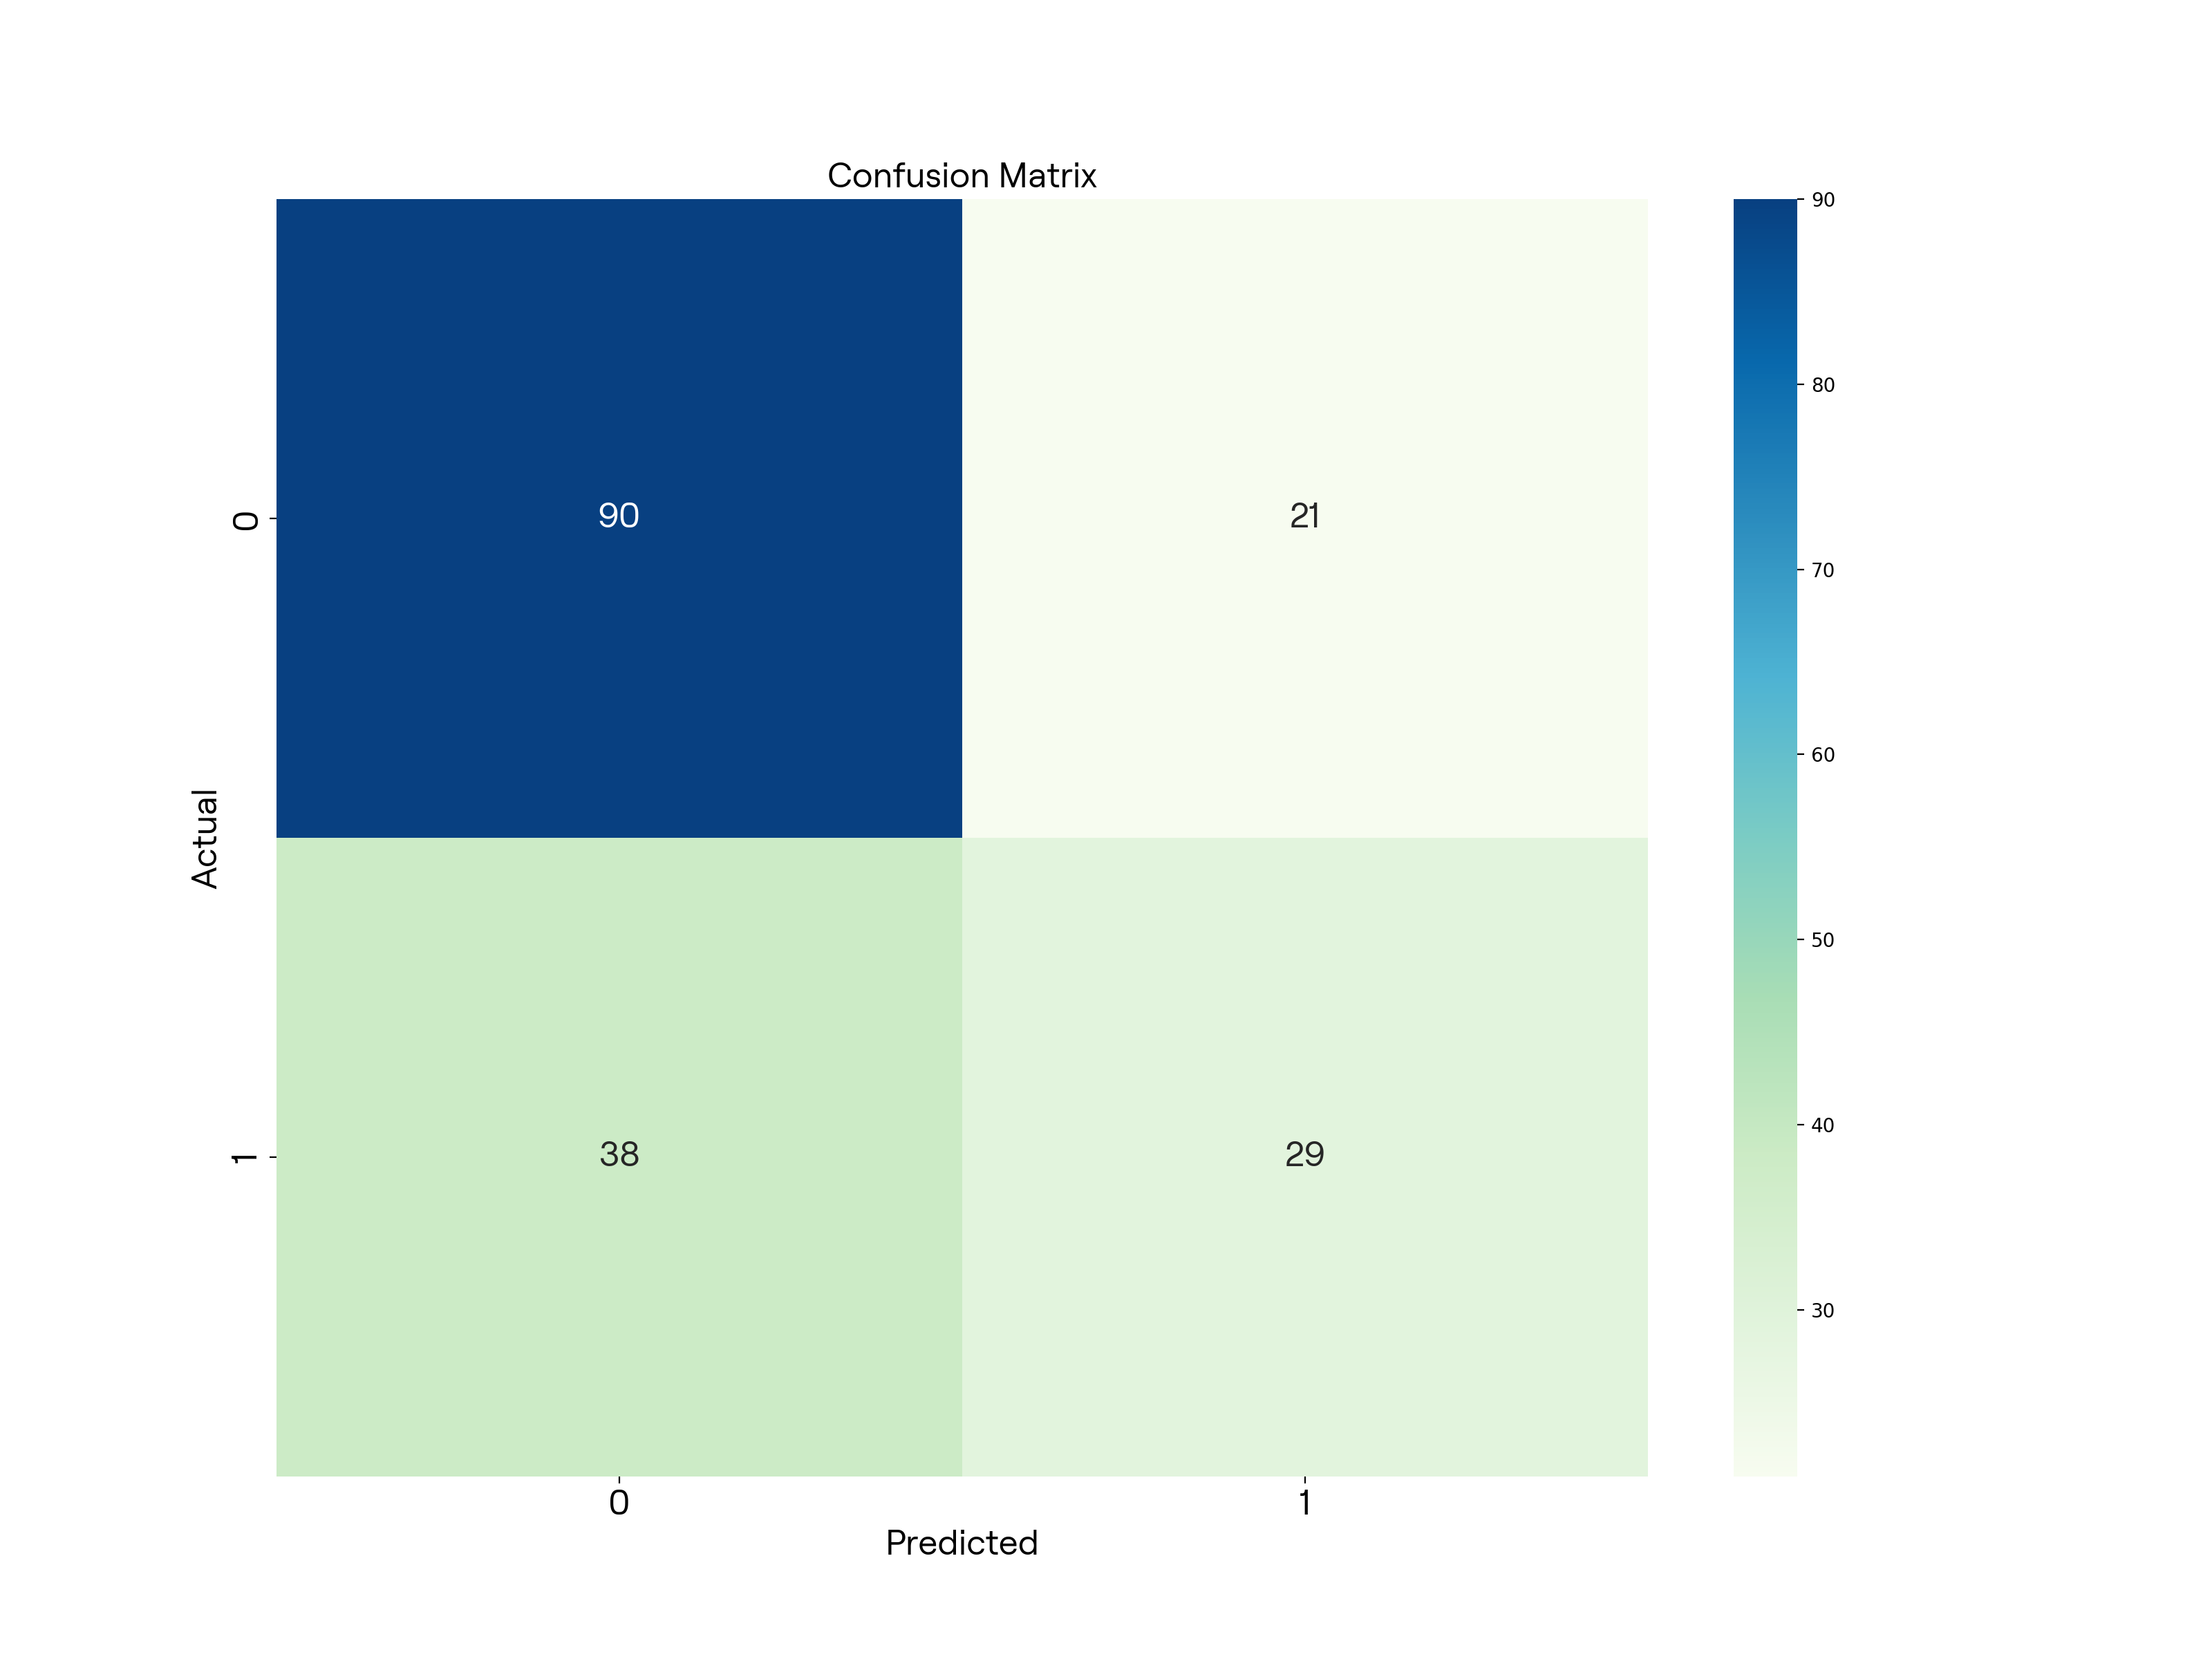
Accuracy: 0.6685393258426966
绘制混淆矩阵
# Plot the confusion matrix
cm = confusion_matrix(y_test, y_pred)
plt.figure(figsize=(16, 12), dpi=200)
sns.heatmap(cm, annot=True, annot_kws={ 'fontproperties': custom_font}, cmap='GnBu')
plt.xlabel('Predicted', fontproperties=custom_font)
plt.ylabel('Actual', fontproperties=custom_font)
plt.xticks(font=custom_font)
plt.yticks(font=custom_font)
plt.title('Confusion Matrix', fontproperties=custom_font)
输出

数据获取
题目
使用一个指定的txt文件中的关键字,从维基百科上爬取相关页面的简介部分,并将结果保存到另一个文件中。
解答
此题目需要在能够访问维基百科的环境下完成,可以点击链接进行了解。
安装并加载必要的库
import wikipedia
从txt文件中获取关键字
def get_wiki_name_from_file(file_name):
    with open(file_name, 'r') as file:
        keywords = [line.strip() for line in file.readlines()]
    return keywords
爬取维基百科页面的简介部分
def fetch_summaries(keywords, output_file, input_file):
    for keyword in keywords:
        print(f"Fetching summary for '{keyword}'")
        try:
            summary = wikipedia.summary(keyword)
            write_summary_to_file(keyword, summary, output_file)
        except wikipedia.exceptions.DisambiguationError as e:
            summary = wikipedia.summary(e.options[0])
            write_summary_to_file(keyword, summary, output_file)
        except wikipedia.exceptions.PageError:
            print(f"Page for '{keyword}' does not exist.")
保存结果到另一个文件
def write_summary_to_file(keyword, summary, output_file):
    with open(output_file, 'a') as file:
        file.write(f"{keyword}: {summary}\n")
主函数
if __name__ == '__main__':
    # Define the input and output file paths
    # default input file path: ./data/wikipedia.txt
    input_file_path = input('Enter the file which contains the keywords: ')
    input_file_path = "./data/wikipedia.txt"
    # default output file path: ./output/output.txt
    output_file_path = input('Enter the file to save the summaries: ')
    output_file_path = "./output/output.txt"

    # Read keywords from file
    keywords = get_wiki_name_from_file(input_file_path)

    # Fetch summaries from Wikipedia
    fetch_summaries(keywords, output_file_path, input_file_path)
输出
由于列表过于庞大,所以这里只展示前几行输出。
控制台
/Users/lucas/miniconda3/envs/Class/bin/python /Users/lucas/Developer/PycharmProjects/Class/OJ02/03/03.py
Enter the file which contains the keywords:
Enter the file to save the summaries:
Fetching summary for 'Acute lymphoblastic leukaemia'
Fetching summary for 'Acute monocytic leukemia'
Fetching summary for 'Acute myeloid leukaemia/Acute myelogenous leukemia'
Fetching summary for 'Acute promyelocytic leukaemia'
Fetching summary for 'Adenocarcinoma'
Fetching summary for 'Adenoma'
文件
Acute lymphoblastic leukaemia: Acute lymphoblastic leukemia (ALL) is a cancer of the lymphoid line of blood cells characterized by the development of large numbers of immature lymphocytes. Symptoms may include feeling tired, pale skin color, fever, easy bleeding or bruising, enlarged lymph nodes, or bone pain. As an acute leukemia, ALL progresses rapidly and is typically fatal within weeks or months if left untreated.
In most cases, the cause is unknown. Genetic risk factors may include Down syndrome, Li–Fraumeni syndrome, or neurofibromatosis type 1. Environmental risk factors may include significant radiation exposure or prior chemotherapy. Evidence regarding electromagnetic fields or pesticides is unclear. Some hypothesize that an abnormal immune response to a common infection may be a trigger. The underlying mechanism involves multiple genetic mutations that results in rapid cell division. The excessive immature lymphocytes in the bone marrow interfere with the production of new red blood cells, white blood cells, and platelets. Diagnosis is typically Acute lymphoblastic leukemia based on blood tests and bone marrow examination.
Acute lymphoblastic leukemia is typically treated initially with chemotherapy aimed at bringing about remission. This is then followed by further chemotherapy typically over a number of years. Treatment usually also includes intrathecal chemotherapy since systemic chemotherapy can have limited penetration into the central nervous system and the central nervous system is a common site for relapse of acute lymphoblastic leukemia.
Treatment can also include radiation therapy if spread to the brain has occurred. Stem cell transplantation may be used if the disease recurs following standard treatment. Additional treatments such as Chimeric antigen receptor T cell immunotherapy are being used and further studied.
Acute lymphoblastic leukemia affected about 876,000 people globally in 2015 and resulted in about 111,000 deaths. It occurs most commonly in children, particularly those between the ages of two and five. In the United States it is the most common cause of cancer and death from cancer among children. Acute lymphoblastic leukemia is notable for being the first disseminated cancer to be cured. Survival for children increased from under 10% in the 1960s to 90% in 2015. Survival rates remain lower for babies (50%) and adults (35%).


Acute monocytic leukemia: Acute monocytic leukemia (AMoL, or AML-M5) is a type of acute myeloid leukemia. In AML-M5 >80% of the leukemic cells are of monocytic lineage. This cancer is characterized by a dominance of monocytes in the bone marrow. There is an overproduction of monocytes that the body does not need in the periphery. These overproduced monocytes interfere with normal immune cell production which causes many health complications for the affected individual.
Acute myeloid leukaemia/Acute myelogenous leukemia: Acute leukemia or acute leukaemia is a family of serious medical conditions relating to an original diagnosis of leukemia. In most cases, these can be classified according to the lineage, myeloid or lymphoid, of the malignant cells that grow uncontrolled, but some are mixed and for those such an assignment is not possible.